
 Over the past couple of months I have been working with colleagues from the Landmap service at Mimas to create an AR experience around the UKMap dataset. The UKMap Collection is one of five collections provided free of charge to the UK academic community at Landmap and was originally collection by The GeoInformation Group.
This provides a wealth of rich, multi-layered information accurately locating building types, building heights and ground usage to name a few. The challenge was to incorporate this tabular data in a visual 3D model that a handheld device was able to render efficiently. The raw data and map files were often hundreds of megabytes, completely unusable on a mobile device. Through a process of trial and error, myself and Gail Millin-Chalabi from Landmap were able to develop a workflow for delivery through Junaio.
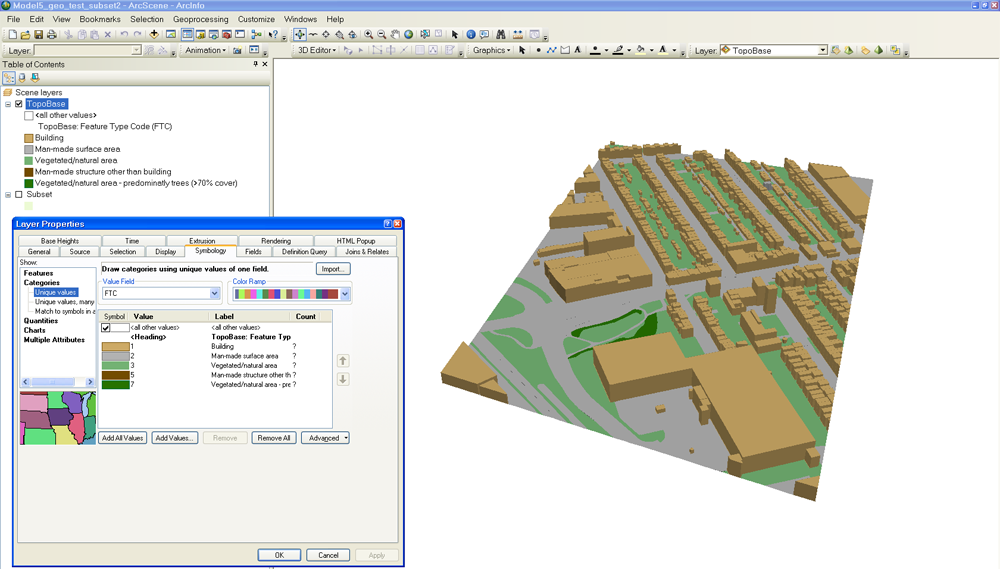
- Firstly ESRI ArcScene was used to create a 3D visualisation of geospatial data layers contained in the UKMap Collection. Then the data layers were clipped to an Area of Interest (AOI) – in this example Lea Bridge Road, Walthamstow, London. The 2D feature data was then converted to 3D feature data and reprojected in WGS84 coordinates from British National Grid. The model was then output as a VRML 3D file for use in Blender.
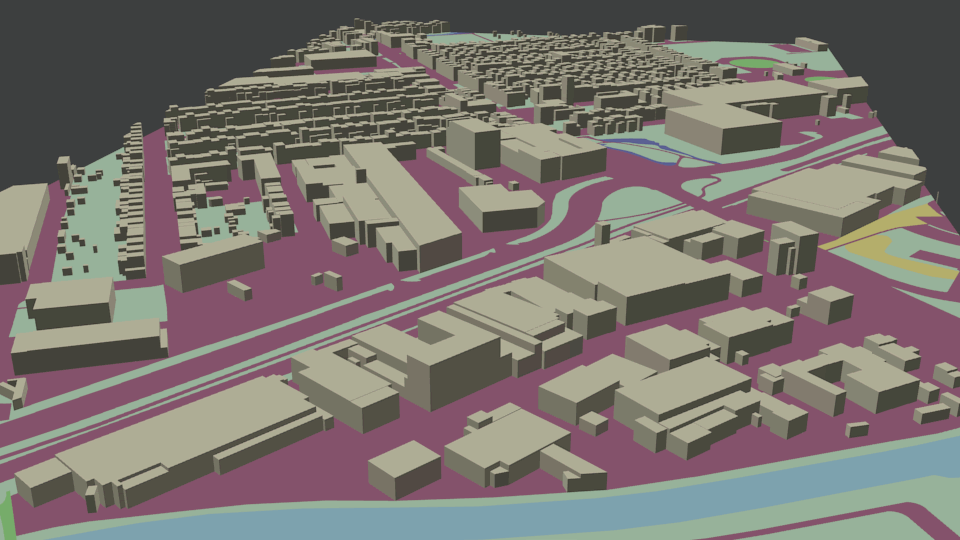 In Blender the model was optimised by reducing polygons, adding lighting and baking textures to allow for efficient delivery through the Junaio channel. There were a couple of issues importing from ArcScene, most notably a number of faces were drawn incorrectly rendering them invisible on final export. This was remedied by painstakingly flipping each face manually and continually checking the final render, I really hope that the next version of ArcScene has a bug fix for this problem!
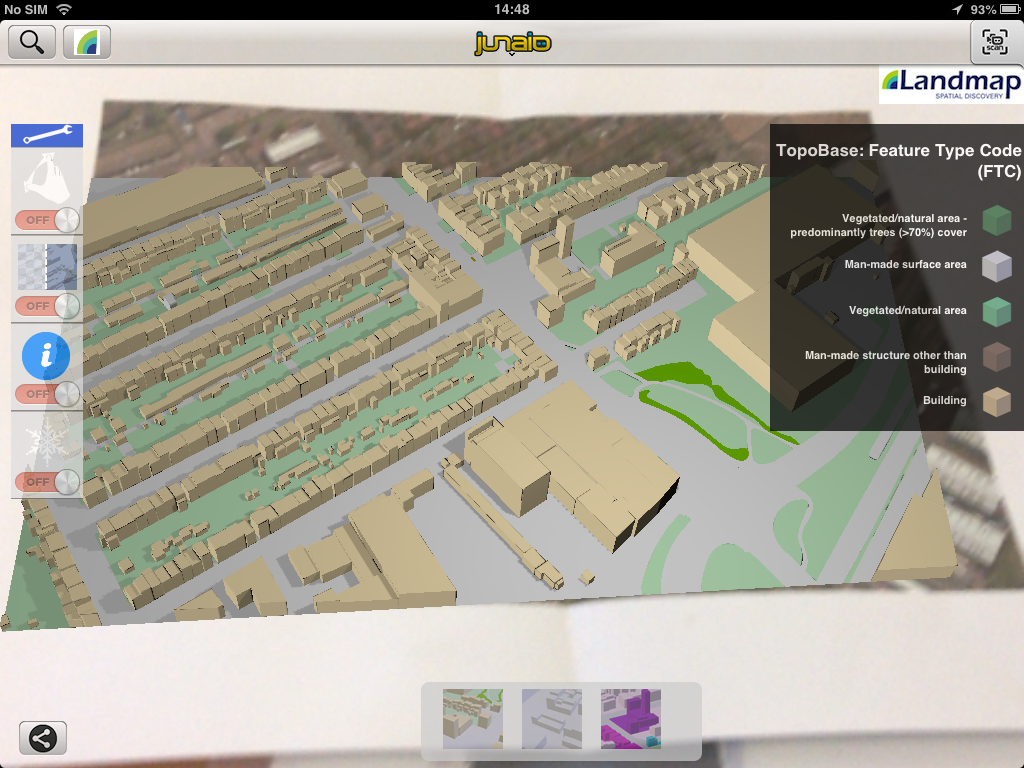
 Finally, I was able to develop a GUI(Graphic User Interface) utilising a transparent HTML5 layer with functionality coded in AREL (Augmented Reality Experience Language) based on Javascript and PHP. This enables the user to control the AR experience by displaying different models (heights, feature classification code), using gestures to rotate and scale the model and transparency to allow comparison to the printed base layer. But perhaps the most exciting piece of functionality, the “Freeze” button allows the user to disable tracking, creating a snapshot of the background and overcoming the need to continually hold the device over the tracking image.

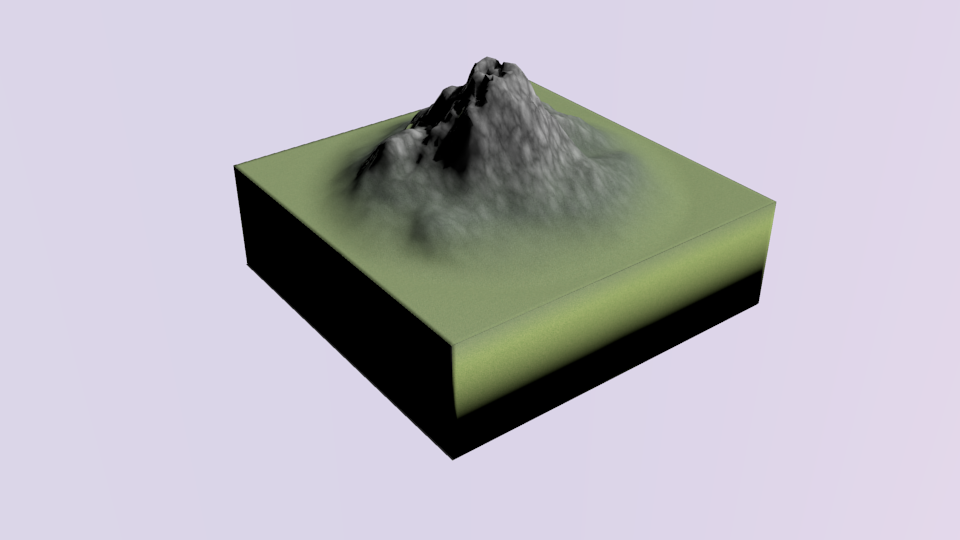
Working so closely to spatial data has opened my eyes to the vast potential of using AR visualisation alongside existing learning activities at several levels from primary to post-graduate education. In the future I hope to investigate how these models could be used to reinforce learning through summative assessment. For example, it would be fairly simple to use building heights to test trigonometry calculations, terrain modelling to examine flood management and geological phenomena such as the anatomy of a volcano (see working model below).
The new Landmap AR app will be released in the next few days, we look forward to receiving your feedback.
Pingback: Innovation in Education – Augmented Reality, a Manchester Showcase | SCARLET (Special Collections using Augmented Reality to Enhance Learning and Teaching)